
Magnetic declination
Over much of the Earth's surface, compass needles point roughly north. However, because of the complex shape of the Earth's magnetic field there are few places where a compass needle will point exactly north. A compass lines up with the horizontal component of the magnetic field in a direction called magnetic north. True north, on the other hand is the direction from a given location to the north geographic pole. The angle between magnetic north and true north is called magnetic declination. Many people believe that a compass needle points at the North Magnetic Pole. This is not true; if you follow your compass needle you will eventually arrive at the North Magnetic Pole, but not by the most direct route.
Terminology
Both declination and variation are used to describe the angle between magnetic north and true north. The term deviation is also used from time to time. Here is an explanation of the differences between the three terms.
- Declination
- This is the term preferred by those who study the magnetic field; it is also the term most commonly used by land navigators. Sometimes the term "magnetic declination" is used.
- Variation
- This term is preferred by mariners and pilots because the word "declination" also has an astronomical usage - the angle of a star or planet above the celestial equator. However, the word "variation" is used by geomagneticians to refer to time changes in the magnetic field.
- Deviation
- In a vehicle such as a ship or aircraft, a compass is influenced by the magnetism of the iron used in the construction of the vehicle as well as the Earth's magnetic field. This causes the compass needle to point in the wrong direction. This directional error is called "deviation". Many people incorrectly use deviation when they mean declination.
The first known determination of magnetic declination was made by the Chinese in about 720 AD. In Europe, the concept of declination was known in the early 1400s, but the first precise measurement of declination was not made until 1510, when Georg Hartman determined the declination in Rome. The importance of declination for navigation was obvious. Mariners quickly devised methods for determining it and began compiling declination values from locations around the world. In 1700 Edmund Halley came up with the idea of showing declination as contour lines on a map ; he used this novel concept to produced the first declination chart of the Atlantic Ocean. Declination charts have been produced on a regular basis ever since.
Halley map
The secular variation of the magnetic field causes declination to change with time. Changes in declination can be quite large. At Yellowknife, NWT, for example, the declination is changing by more than one degree every three years. On the other hand, at Ottawa, the yearly change in declination is almost zero. The diagram shows the change in declination at several locations in Canada.
Secular variation
Magnetic declination also undergoes changes that are much more rapid than secular variation and are a result of magnetic activity. These variations can be smooth and cyclic, with amplitudes of several minutes of arc in southern Canada, or, during magnetic storms, large and erratic. Changes in declination become increasingly irregular in both amplitude and frequency as one approaches the North Magnetic Pole, a result of the weak horizontal component of the magnetic field. The number of times per year that a compass user will be affected by changes in declination caused by magnetic storms will depend both on the user's application and location. The diagram shows the percentage of days in a typical year during which magnetic declination will fluctuate by more than a given amount from its normal value.
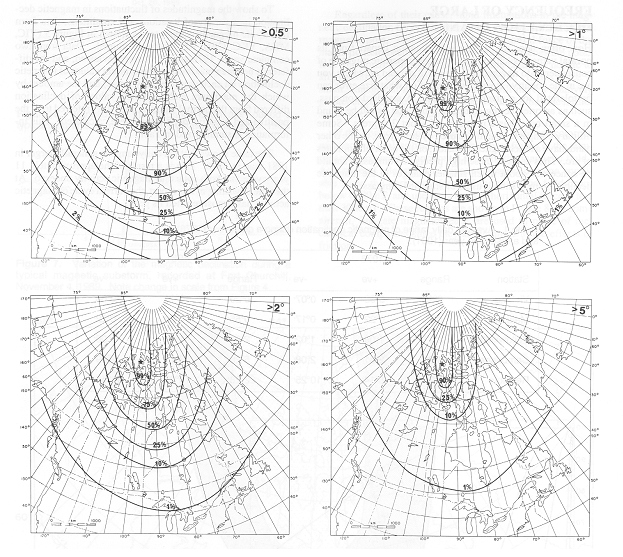
Probability of deviations
Most standard orienteering compasses have a precision of about 2 degrees. It can be seen that in Southern Canada users of such compasses will seldom experience fluctuations larger than 2 degrees. However, someone on a canoe trip in the NWT would find his or her compass in error by more than 2 degrees on more than 1 day in 4.
How to determine declination
There are several ways for compass users to determine declination:
From a map
Canadian topographic charts contain a diagram in the margin which gives the declination for the year in which the chart was published. Beneath the diagram is a statement informing the user about the annual change of declination. By multiplying the annual change by the number of years that have elapsed since the chart was published and adding the total change to the published declination value, the user obtains the present day declination.
Topographic declination diagram
Statement of magnetic declaration taken from Canadian topographic map:
Magnetic declination 1992 varies from 16°05′ easterly at centre of west edge to 14°03′ easterly at centre of east edge. Mean annual change decreasing 11.5.
Here is an example:
- Declination in 1998: 13° 15′ W
- Annual change: decreasing 5′
Since the annual change is decreasing, treat it as negative. Therefore Declination in 2003 is:
It is important to remember that the annual change does not remain constant with time. Therefore, using the annual change to update the declination on an old map is likely to result in an error in the updated declination.
It is also important to know that the declination shown in the diagram on the topographic map is not the true declination. Declination is defined as the angle between magnetic north and the true north. However, the diagram on the topographic map sheet gives the value of the angle between magnetic north and grid north, which is referenced to the grid lines shown on the map. This angle is properly called grid declination. The angle between grid north and true north is called the convergence angle. To obtain the true declination it is necessary to add or subtract the convergence angle to the Grid Declination. The diagram illustrates four possible combinations.
Grid (square), true (star) and magnetic north (arrow)
In the diagram,
- the star indicates true north;
- the square indicates grid north;
- the arrow indicates magnetic north;
- G refers to grid declination;
- C is the convergence angle;
- D refers to the declination.
All quantities are considered positive. Four cases are illustrated:
- Magnetic north west of true north; grid north west of true north;
- Magnetic north west of true north; grid north east of true north;
- Magnetic north east of true north; grid north west of true north;
- Magnetic north east of true north; grid north east of true north.
Declination is also shown on aeronautical charts as contour lines and on hydrographic (marine) charts either as contour lines or in the form of a compass rose, depending on the scale of the chart. In all cases, true declination is given.
From a magnetic declination chart
Maps of the Earth's magnetic field are available from the National Geophysical Data Center of the National Oceanic and Atmospheric Administration : https://www.ngdc.noaa.gov/geomag/magfield-wist/