Secular variation
The Earth's magnetic field is slowly changing on time scales that range from years to millennia. Such changes are referred to as secular variation. Secular variation was first recognized in 1634 when Gellibrand compared magnetic declination observations he had made at London with earlier observations. The observations of declination made at London over the years constitute one of the best records of secular variation.

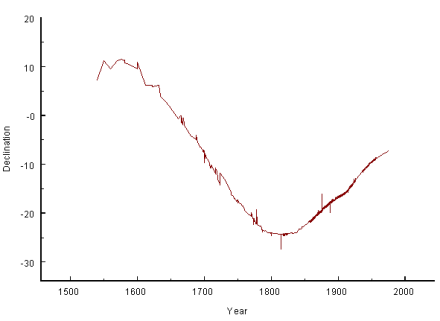
Change in declination at London
The figure shows that declination has changed from approximately 10° E in the late 16th century to 25° W in the early 19th century before returning to a current value of about 3° W.

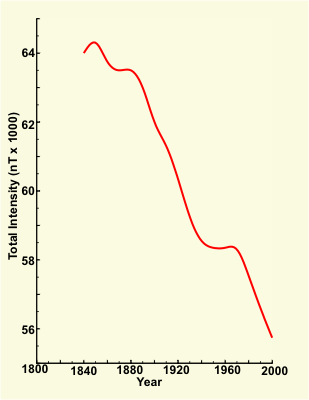
Change in F at Toronto
All elements of the magnetic field change with time - not just the declination. For example, the total intensity at Toronto has decreased 14%, from approximately 64,000 nT to 55,000 nT, during the last 160 years.

World Secular Variation Z
The accompanying map shows the annual change (the secular variation over one year) of the vertical component of the magnetic field.
These three figures illustrate two important points about secular variation: it is not constant in time and it varies from place to place. The average annual change of the vertical component (excluding sign) is about 45 nT per year. However the chart shows areas of intense secular variation called isoporic foci where the SV can be a factor of four larger than this. In the most intense isoporic focus the SV exceeds 170 nT (decreasing).
Analyses of the secular variation show that most of it can be described in terms of three processes:
- a decrease in the strength of the dipole part of the magnetic field
- a westward drift in the non-dipole part of the magnetic field
- changes in the non-drifting part of the non-dipole field
A comparison of the dipole part of the magnetic field calculated from spherical harmonic models produced for different years shows that the strength of the dipole has been decreasing since the early nineteenth century. Archeomagnetic evidence shows that this decrease has, in fact, been going on for the last two thousand years, and that the strength of the dipole now is only about half of what it was two millenia ago. The dipole strength is currently decreasing at a rate of about 6.3% per century, and were it to continue to decrease at that rate, the strength would reach zero in approximately 1600 years. On the other hand, it might start to increase again sometime during the next few decades.

Drift of the agonic line
In the early eighteenth century Edmund Halley noticed that the agonic line, the line of zero declination on a declination chart, was slowly moving westward. Since then it has been well established that certain features of the secular variation, such as isoporic foci, tend to drift westward with an average velocity of about 0.2° per year. However, westward drift is not equal everywhere. It is stronger in the Atlantic hemisphere than in the Pacific hemisphere. It was also less than average in North America over the past 150 years.

F decay
There are certain features of the geomagnetic field that do not drift; they appear to grow and decay in roughly the same place. A persistent feature of the geomagnetic field over Canada has been a large maximum in total intensity centred approximately over northern Manitoba. Total force observations made in the first half of the 18th century show that it was present at that time. There is also evidence that it may actually be a semi-permanent feature of the magnetic field with a lifetime of millions of years. However, since the mid-nineteenth century, the maximum has been decaying rapidly while remaining roughly stationary. The figure shows a decrease of over 4000 nT during the 20th century.
Secular variation, like the magnetic field itself, originates in the outer core of the Earth, and is an integral part of the process by which the field is generated. Several different mechanisms are probably involved, resulting in changes on different time scales, which can mostly be described in terms of the three processes described earlier. However, at the short end of the secular variation time scale is one of the most interesting features of secular variation - the geomagnetic jerk. Jerks were first discovered by a group of French researchers (Courtillot et al., 1978), who noticed that at many magnetic observatories the trend in secular variation before 1969 differed markedly from the trend after 1969. This change in trend was most noticeable in the east component of the magnetic field at European observatories, but it was evident at almost all the world's observatories, and it happened at roughly the same time everywhere.

Theoretical jerk
There are three plots in the accompanying diagram:
- shows the change of a magnetic field component with time
- shows the change in secular change (obtained by taking the year to year change of the first plot) with time; the sudden change in slope at year 0 is the tell-tale sign of a jerk
- shows the change in secular acceleration is plotted with time; here the jerk shows up as a step change - constant acceleration before the jerk, constant acceleration with a different value after the jerk.

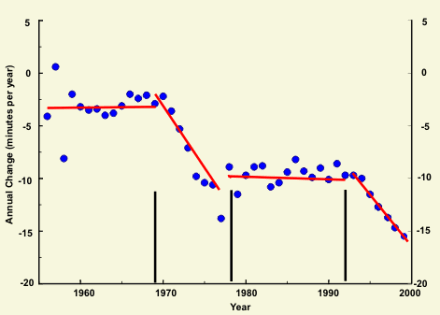
Meanook jerk
Since the discovery of the 1969 jerk , scientists have found five additional jerks of global extent during the twentieth century: in 1901,1913,1925,1978 and 1992. The last two of these, as well as the 1969 jerk, can be seen in the figure, which shows the annual change in declination at Meanook Magnetic Observatory, north of Edmonton.